Infographic and Data Visualization
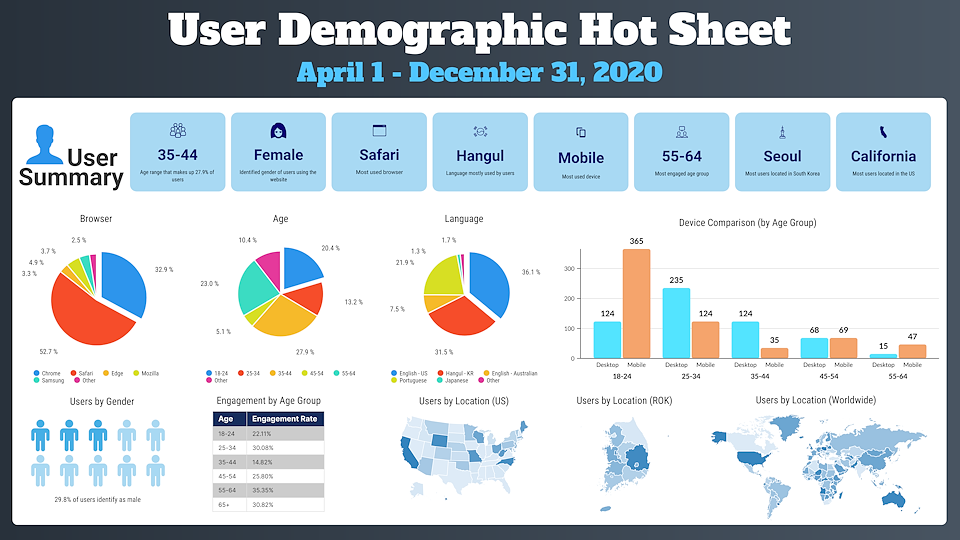
My expertise in infographics and data visualization combines design acumen with analytical skills to transform complex information into visually engaging and easily understandable formats. I specialize in creating compelling infographics that distill data into clear, concise visuals, aiding in effective communication and decision-making. My work in this area includes designing charts, graphs, and interactive visualizations that not only highlight key insights but also enhance storytelling. This collection showcases a range of projects where I’ve applied these skills to convey data-driven narratives in a visually appealing and impactful manner.
Role |
Designer |
For |
United States Forces Korea |
Date |
2020-2024 |
Type |
infographics, design, digital |
/background(fff)/960x741.jpeg?auto=webp)
A guide designed for incoming personnel during peak COVID traveling.
/background(fff)/960x678.jpeg?auto=webp)
This infographic/article is a poster designed for display to explain the Demining Operations being done by the UNC Military Armistice Commission. This was posted in the JSA.

This was a printed and digital flyer that was notify the population about an uptick in smishing attacks.